
Striking the Right Balance


Image

STRIKING THE RIGHT BALANCE

Optimizing Supply Chain Network to Manage Costs
Image

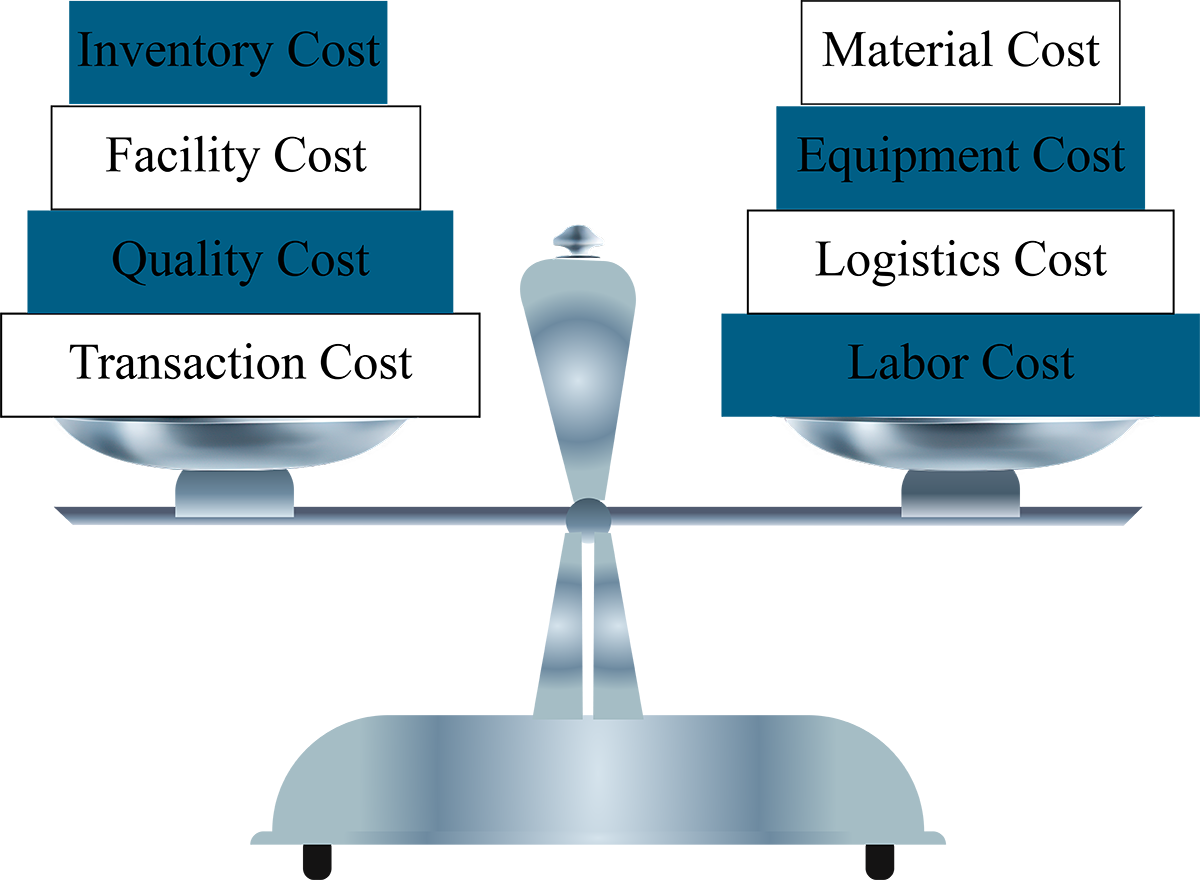
There are at least four major functions that play a role in affecting supply chain costs: material procurement, supply chain distribution, facilities management, and operations management. Within these functions, there are departments whose work can affect or upset the balancing act that is required when designing solutions with a lean management approach.

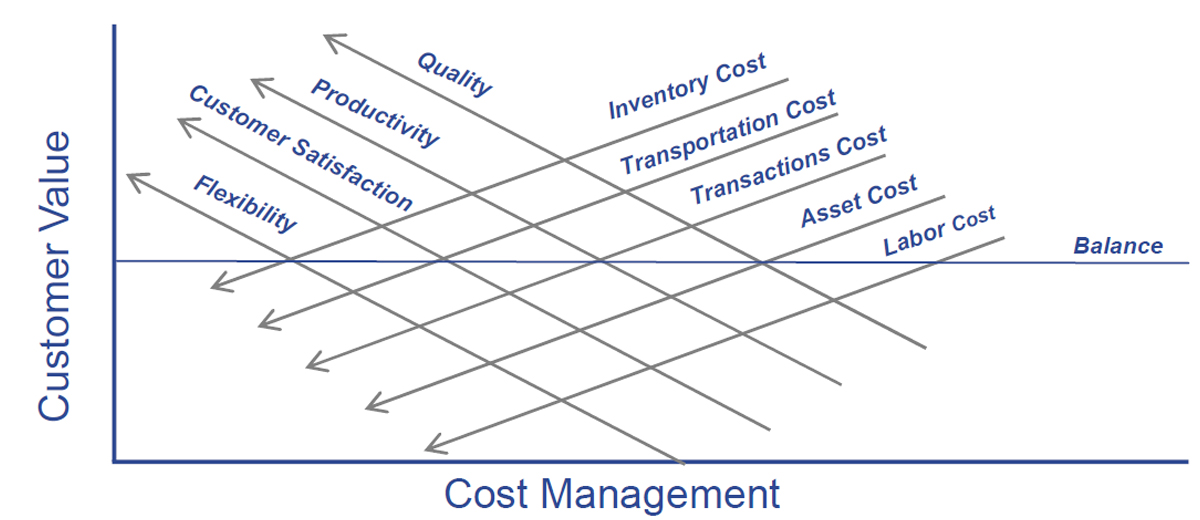
In the SCOM© approach, ASW leads client team members through a comprehensive program in which ASW and the various client departments work together across functional lines to understand the essential components that need to be in balance. By managing these components, the model consistently achieves the best value for ASW’s client and the client’s end customer.
Image

Typical data elements that must be factored include:

  • Inventory level
  • Packaging requirements (size, kind, weight, parts per pallet)
  • Material cost
  • Suppliers
  • Delivery and return frequency
  • Facility requirements
  • Engineered standard work hours
  • Shrinkage
  • Safety stock requirements

Supply Chain Optimization Model© SCOM For One Utility

This article presents just one example of SCOM©, customized for a utility company. Like most organizations, existing business processes were long established and embedded in the client’s operations.However a new project surfaced, the implementation of Automated Meter Reading (AMR) allowing the client team to look at the best methodology to accomplish the project. The project approach allowed procurement, operations, and logistics executives to review existing assumptions, identify efficiencies and inefficiencies, pilot implementation without dissembling the whole process, and assess an application in a real environment which allows for validated outcomes and ROI.
The team customized SCOM© specifically for two commodities (AMR’s and ERT’s) to demonstrate process capability with validated results. SCOM© resulted in establishing an Origin Distribution Center at ASW’s facility in Mogadore, Ohio, that would receive Less-Than-Truckload (LTL) and Truckload (TL) shipments to consolidate and deliver in Milk Runs (TL’s) to the operating facilities at a planned replenishment frequency. The team’s objective was to optimize the network to provide the best total cost value and operating efficiency. The team adjusted various distribution process elements, including order releases, install data systems and safety stock requirements, delivery frequencies, network min/max levels, and transportation planning.
While the existing model that the utility used may have worked as designed for normal operations, it was insufficient to support intense business and process control requirements cost effectively. Process inefficiencies are typical of mature supply chain models and are summarized in Tables A and B.

Process Inefficiencies for Project Implementation

  • The meter distribution process failed to give visibility to the total management network process and actual cost structure
  • The logistics and distribution process inherently optimized pieces of the network without balancing the enterprise cost.
  • The process was not designed to optimize transportation, facility management, warehousing and inventory management cost.

Resulting Outcomes From Inefficiencies

  • Meter inventories far exceeded reasonable levels.
  • Transportation costs were above industry levels.
  • Local warehouse facilities were running out of storage space.
  • The proper inventory and material recovery cost accounting procedure (or lack of) drove a great deal of administrative work for the operations team.
  • The cost and complexity of managing the in-stock inventory exceeded the material purchase cost volume discount in some cases.

Table A

Table B

The first step was to analyze current state. Some of this required retrieving existing data or identifying how to gather data not available. The team conducted physical visits to several facilities to complete the “current state” process maps and validate the data collection process. The team developed a static simulation tool that supported a “what if” analysis to assist in striking the right balance for setting direction. Various cost comparison analyses were developed to display the relationship with inventory cost to storage and handling cost, as well as the transportation delivery frequency to storage and inventory cost. The costing tool assisted the team in identifying, balancing and managing the impact of alternative decisions with a higher confidence level. The results were used to provide graphical depiction to illustrate the expected outcomes to the impacted organizations. The graphics also assisted the team to visualize and develop data driven conclusions.
The selected alternative established a channel to synchronize the inbound and outbound flow of material to achieve an economic delivery frequency to the local operating facilities while balancing inventory levels, warehousing and labor management.

Supply Chain Optimization Model© SCOM Results

The selected solution is forecasted to yield annual savings of over 20% of the cost for inbound transportation, coupled with an estimated 50% savings on outbound transportation to and from local operation shops. A 100% savings on material recovery will offset the slight increase in warehousing and handling costs of less than 10%.
The project’s initial results are on target to achieve greater-than-projected savings, the total network cost will be reduced by as much as 60+%, and the improvements that were made in the material recovery process will be approximately 60% of the logistics and distribution cost. The improvements of inventory accuracy will result in savings of almost 15% in inventory carrying costs and the improved transportation model and planned replenishment will allow for a dramatic reduction in on-hand meter inventory. These savings and measurable data have encouraged the team to accelerate the planned phased implementation.

Industry Applications for SCOM©

Material complexity and system variation are inherent to the nature of the utility business. By integrating ASW’s supply chain approach, the client can achieve efficiency improvements. The study was completed using two commodities (Meters and ERT’s). For utility clients, the process would work equally well for Smart Meter and advanced technology grid repair.

For other industries, the processes, systems and analyzing tools used to complete the project can be applied to study any commodity. While the process for achieving results can be difficult, the commitment demonstrated by operations leadership to evaluate and change business processes will yield substantial operating benefits. Table C highlights why the process works.

Six Sigma and lean supply chain management are not new concepts and yet they remain elusive for many industries due to the inter-dependencies of the various elements of the overall business process. Through SCOM© ASW demonstrates that not all supply chain elements respond in a synchronized way and will require balance to achieve the best results for the company. Using the six sigma process, the ASW project team was relentless in its quest for continuous improvement to meet customer needs by focusing on data, process alignment, bottom line results and process transformation.

Reference

Supply Chain Game Changers: A Practitioner’s Guide for Driving
Competitive Advantage Within Your Supply Chain.